Climate Maps
|
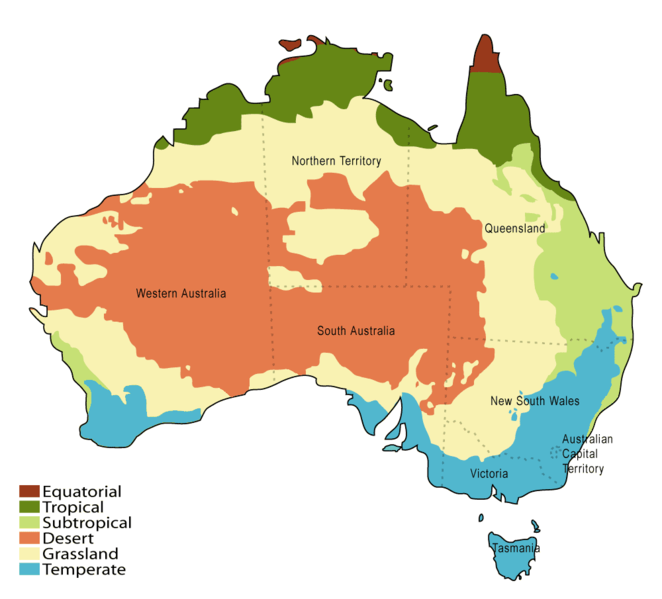
Climate Maps usually show the average snow/rainfall of an area, the natural weather and the average temperature for winter and summer. They use colours to show the temperature. For example; red in the middle of Australia because it's hot, and green, blue or white on the coast because it is cooler.
|
